Figures
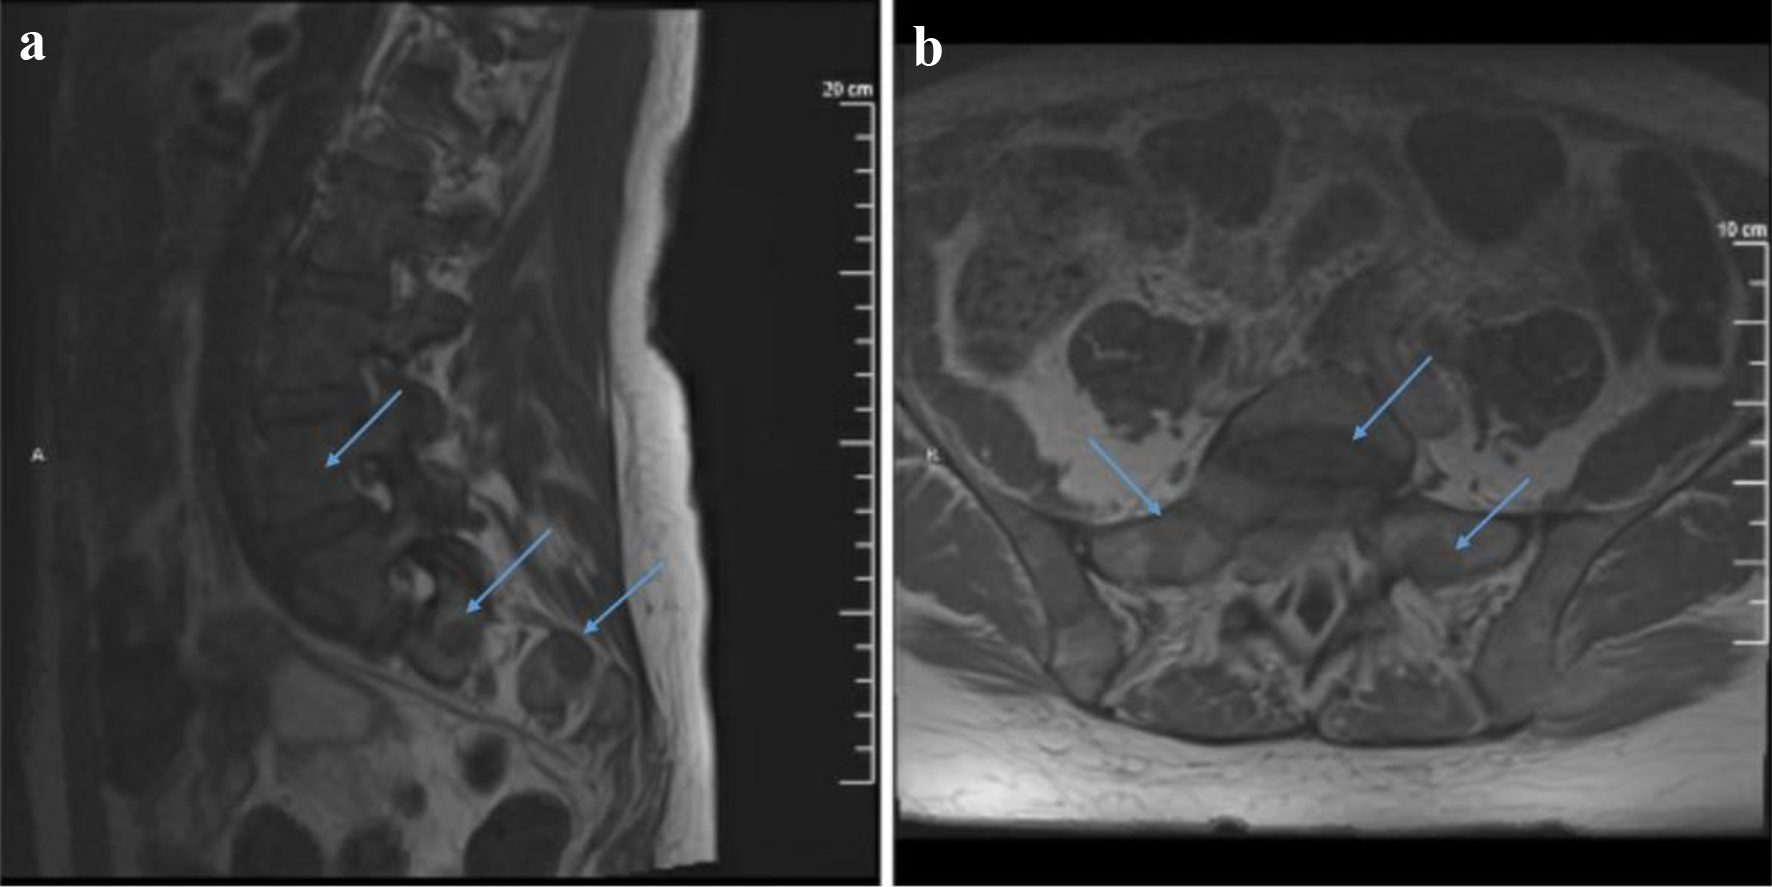
Figure 1. T1-weighted MRI with contrast sagittal (a) and axial (b) views showing multiple lesions throughout the visualized spine. A mass centered at S1 extends into the epidural space as well as into the right S1-S2 neural foramen and compresses upon the exiting S1 nerve root. It also shows possible involvement of the right S2 neural foramen by an additional lesion. MRI: magnetic resonance imaging.
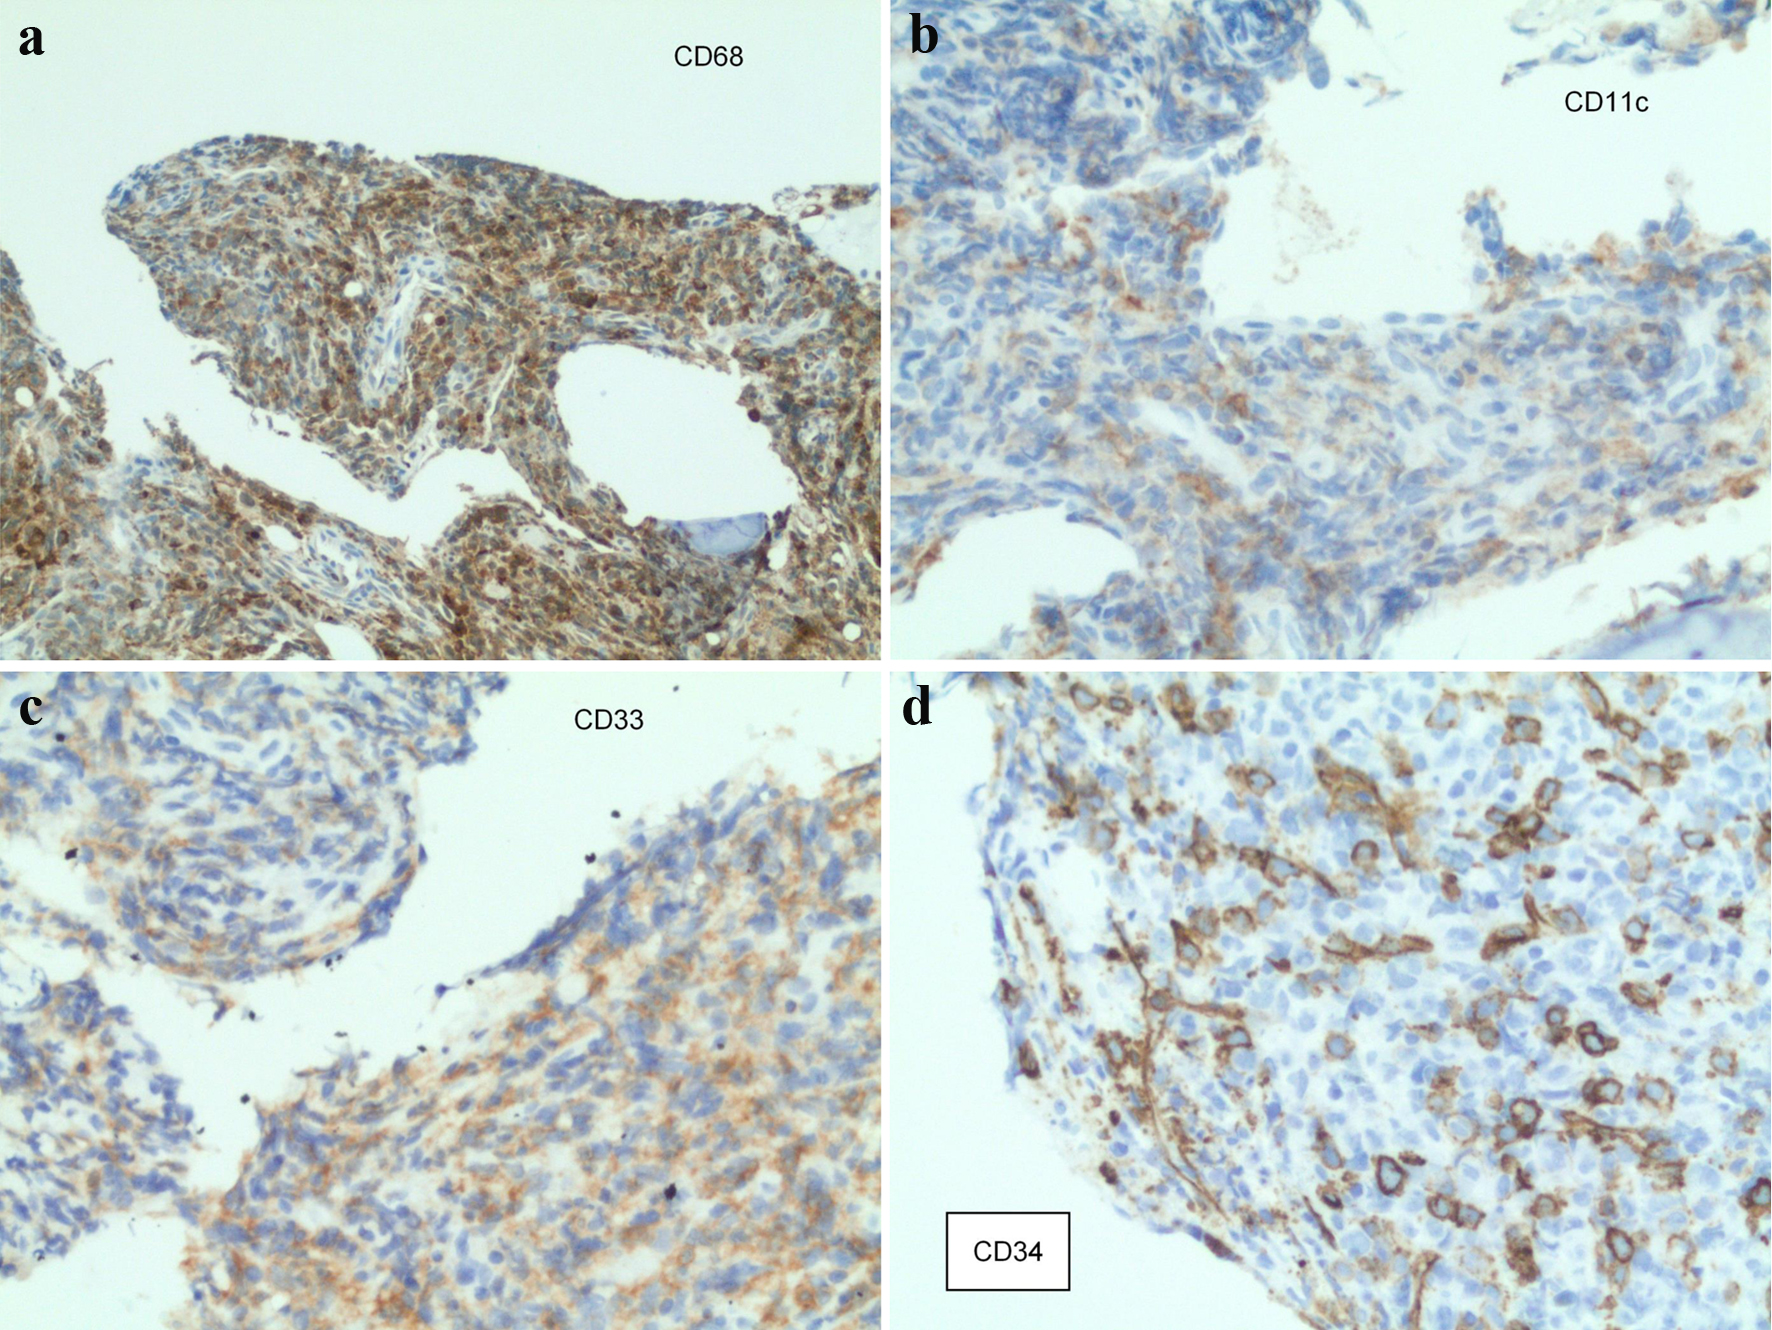
Figure 2. Staining from the sacral mass biopsy: (a) CD68-positive cells; (b) CD11c-positive cells; (c) CD33-positive cells; (d) CD34-positive cells.
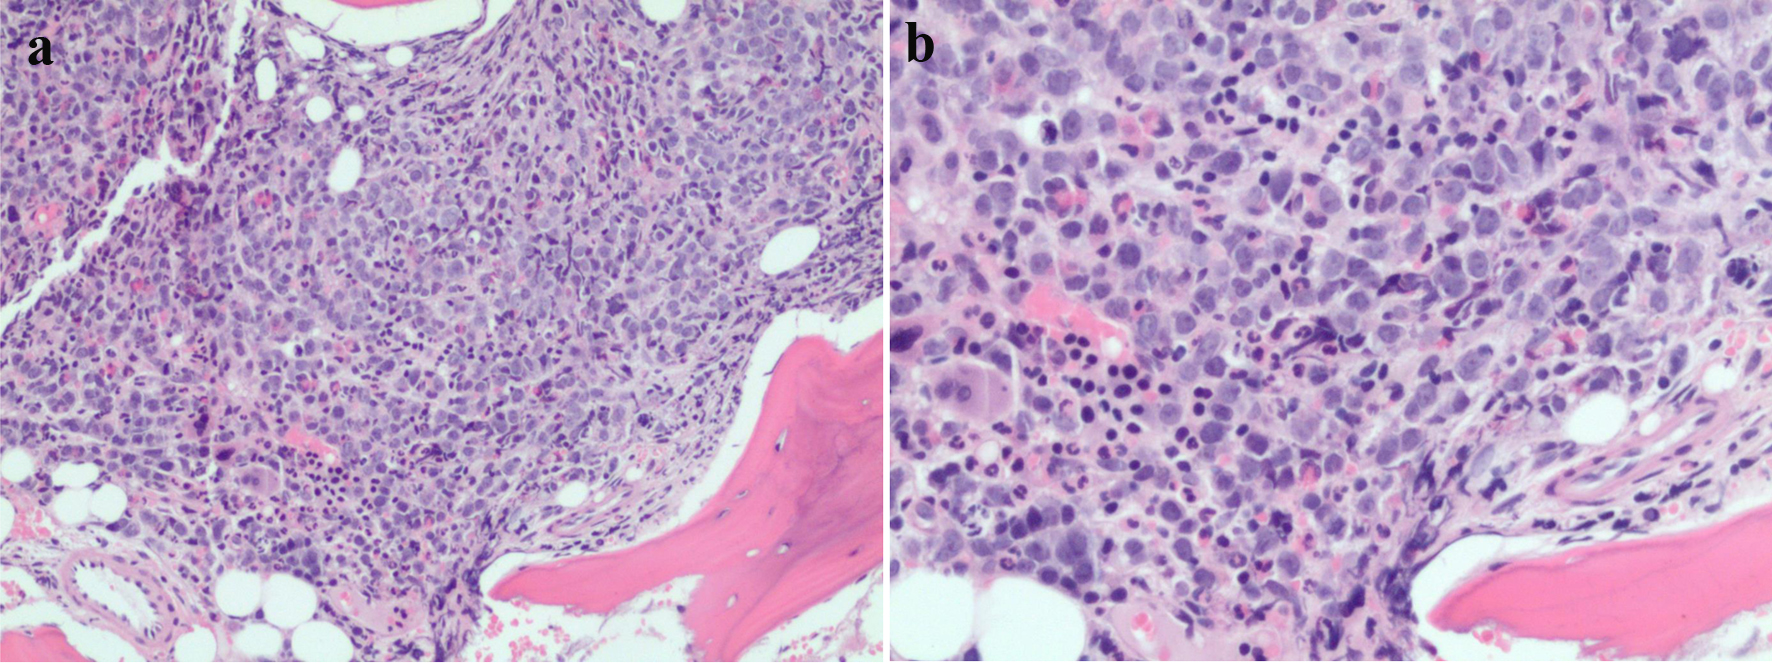
Figure 3. (a, b) Bone marrow pathology sample showing increasing mononuclear cells.
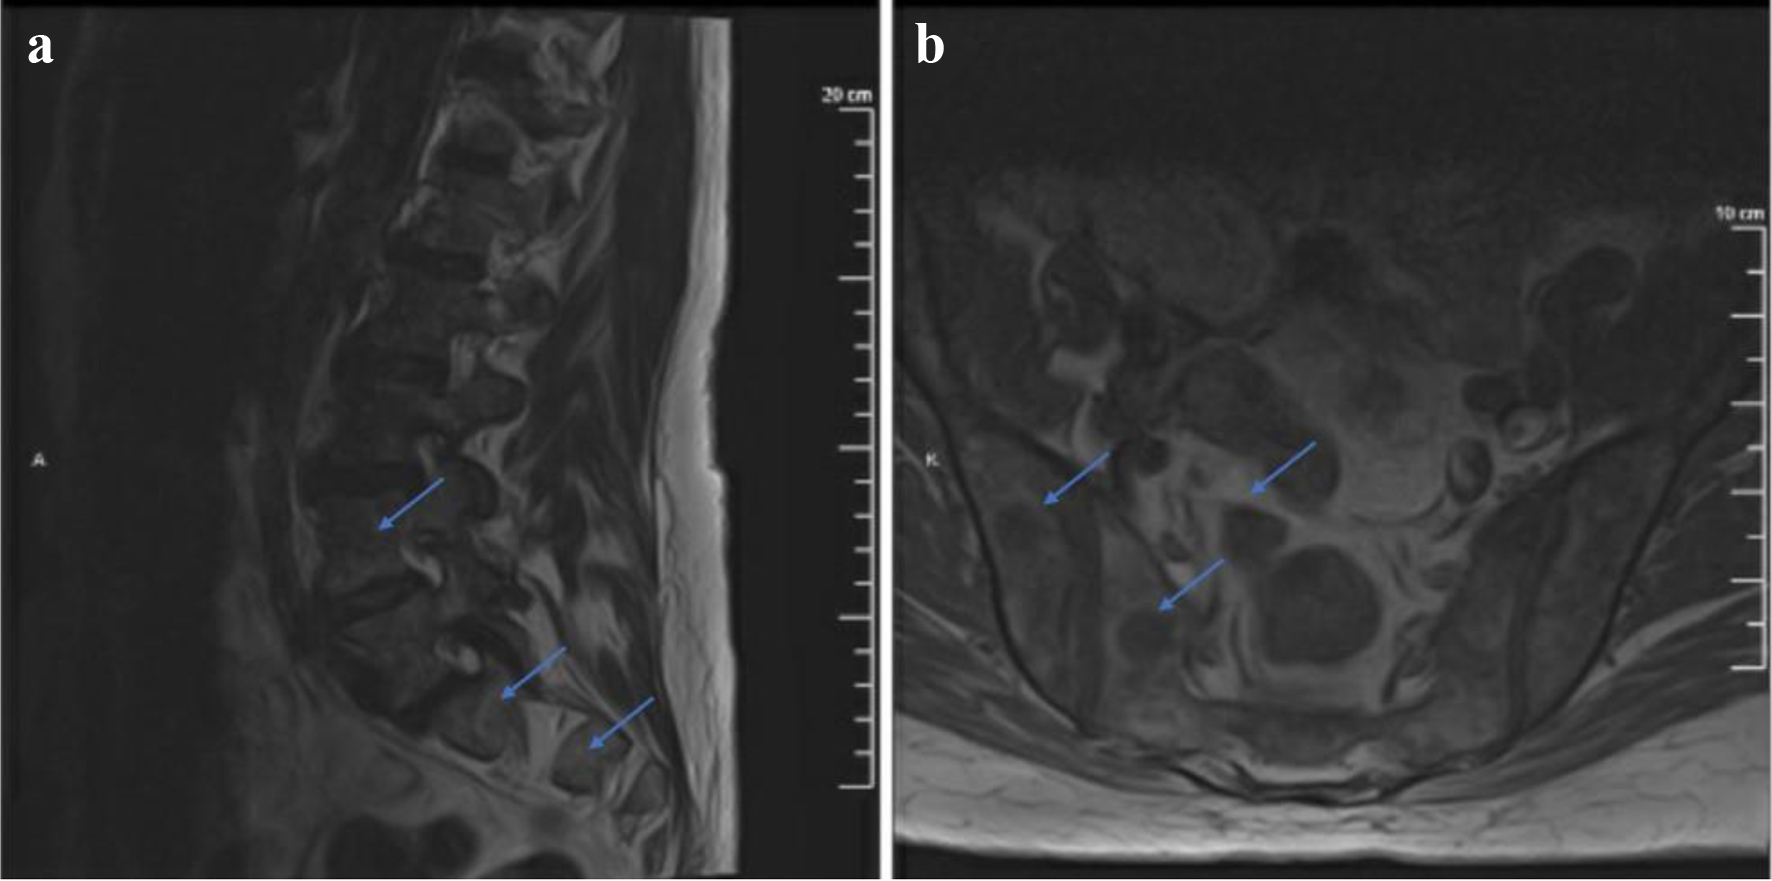
Figure 4. T1-weighted MRI with contrast sagittal (a) and axial (b) views showing marrow signal abnormality identified throughout the lumbosacral spine. The S1 mass described previously appears less prominent. MRI: magnetic resonance imaging.
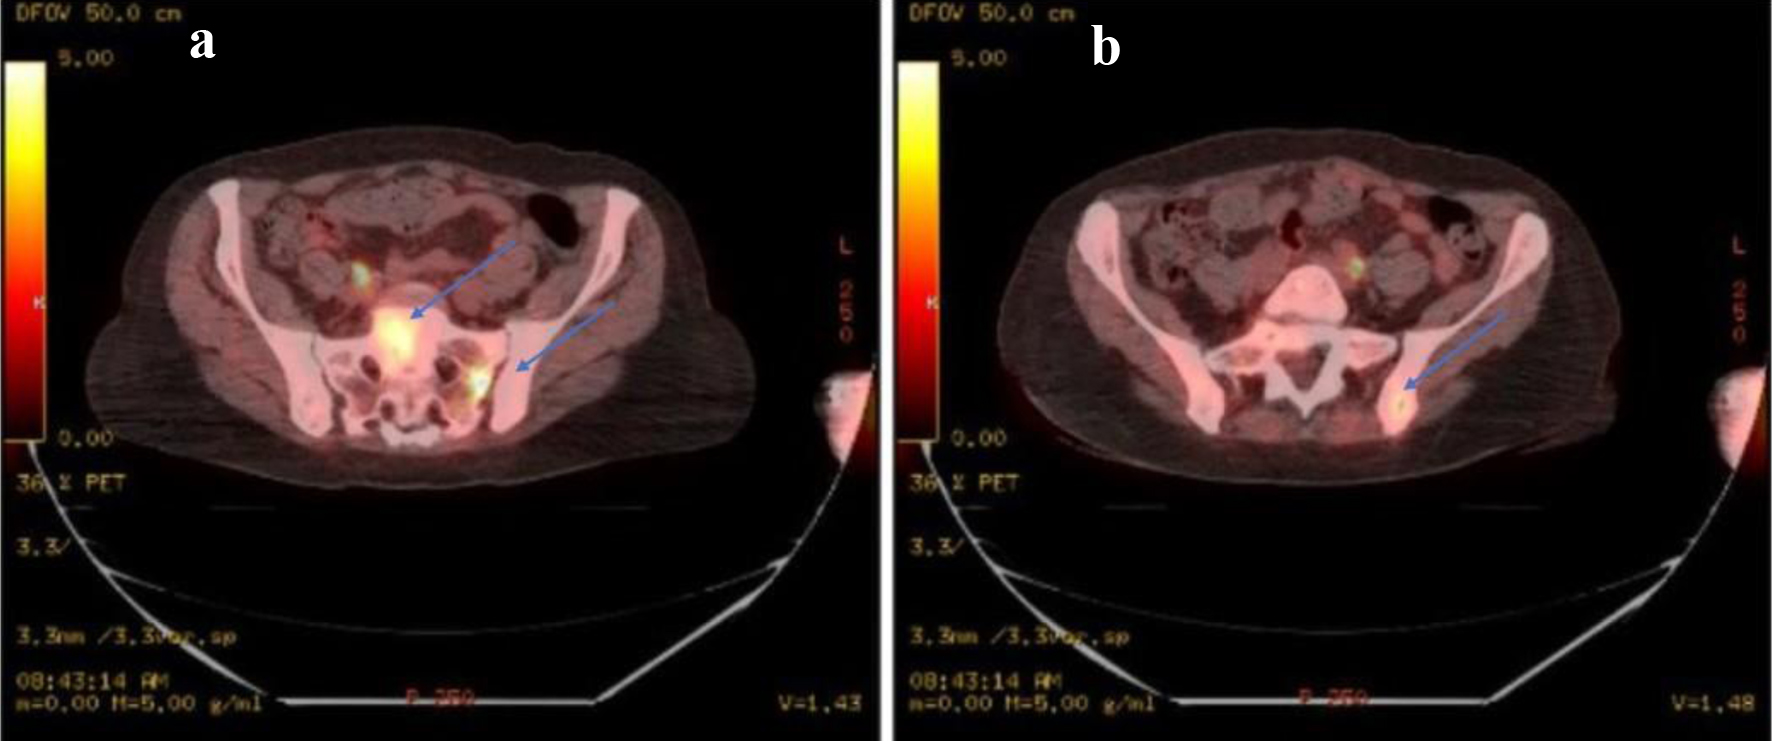
Figure 5. (a) PET-CT identifying focal areas of SUV activity. There are intense areas of activity identified within the sacrum, in the left sacral alar with an average SUV of 1.9 and a maximum SUV of 4.3 as well as in the mid sacrum S1 level with an average SUV of 2.1 and a maximum SUV of 4.2. (b) There is an average SUV of 1.6 with maximum of 3.0 in the posterior left iliac bone adjacent to the sacroiliac joint as well. Discrete lesions in these areas are not identified. PET: positron emission tomography; CT: computed tomography; SUV: standard uptake value.