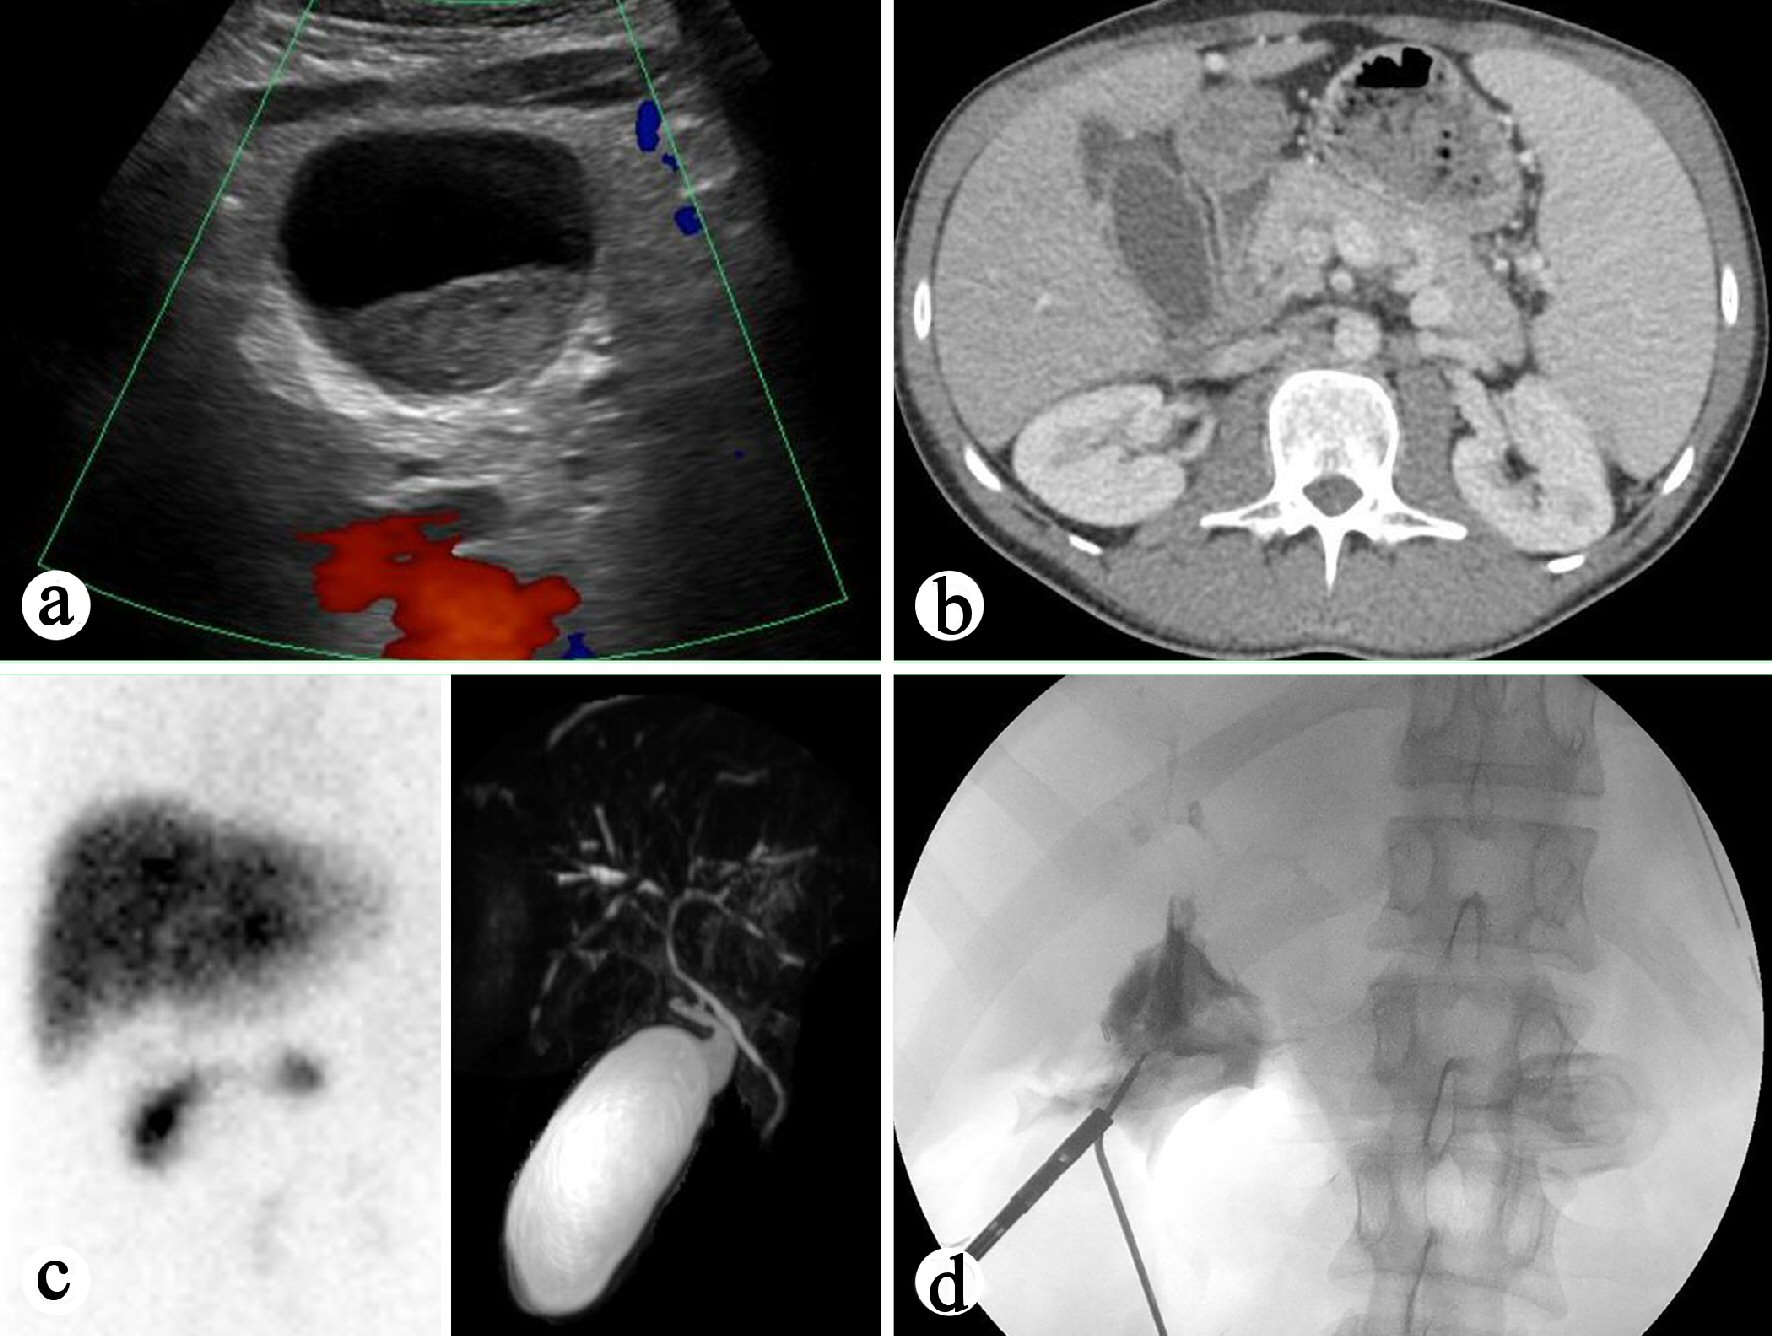
Figure 1. Preoperative and intraoperative imaging study of the gallbladder. (a) Right upper quadrant ultrasound showing distended gallbladder. (b) CT of the abdomen showing enhancing common bile duct. (c) Left: HIDA biliary study revealing no filling of the gallbladder. Right: MRCP demonstrating dilated gallbladder and mild associated stranding concerning for acute cholecystitis. (d) Intraoperative cholangiography revealing atretic common bile duct with moth-eaten appearance, features concerning for cholangitis.
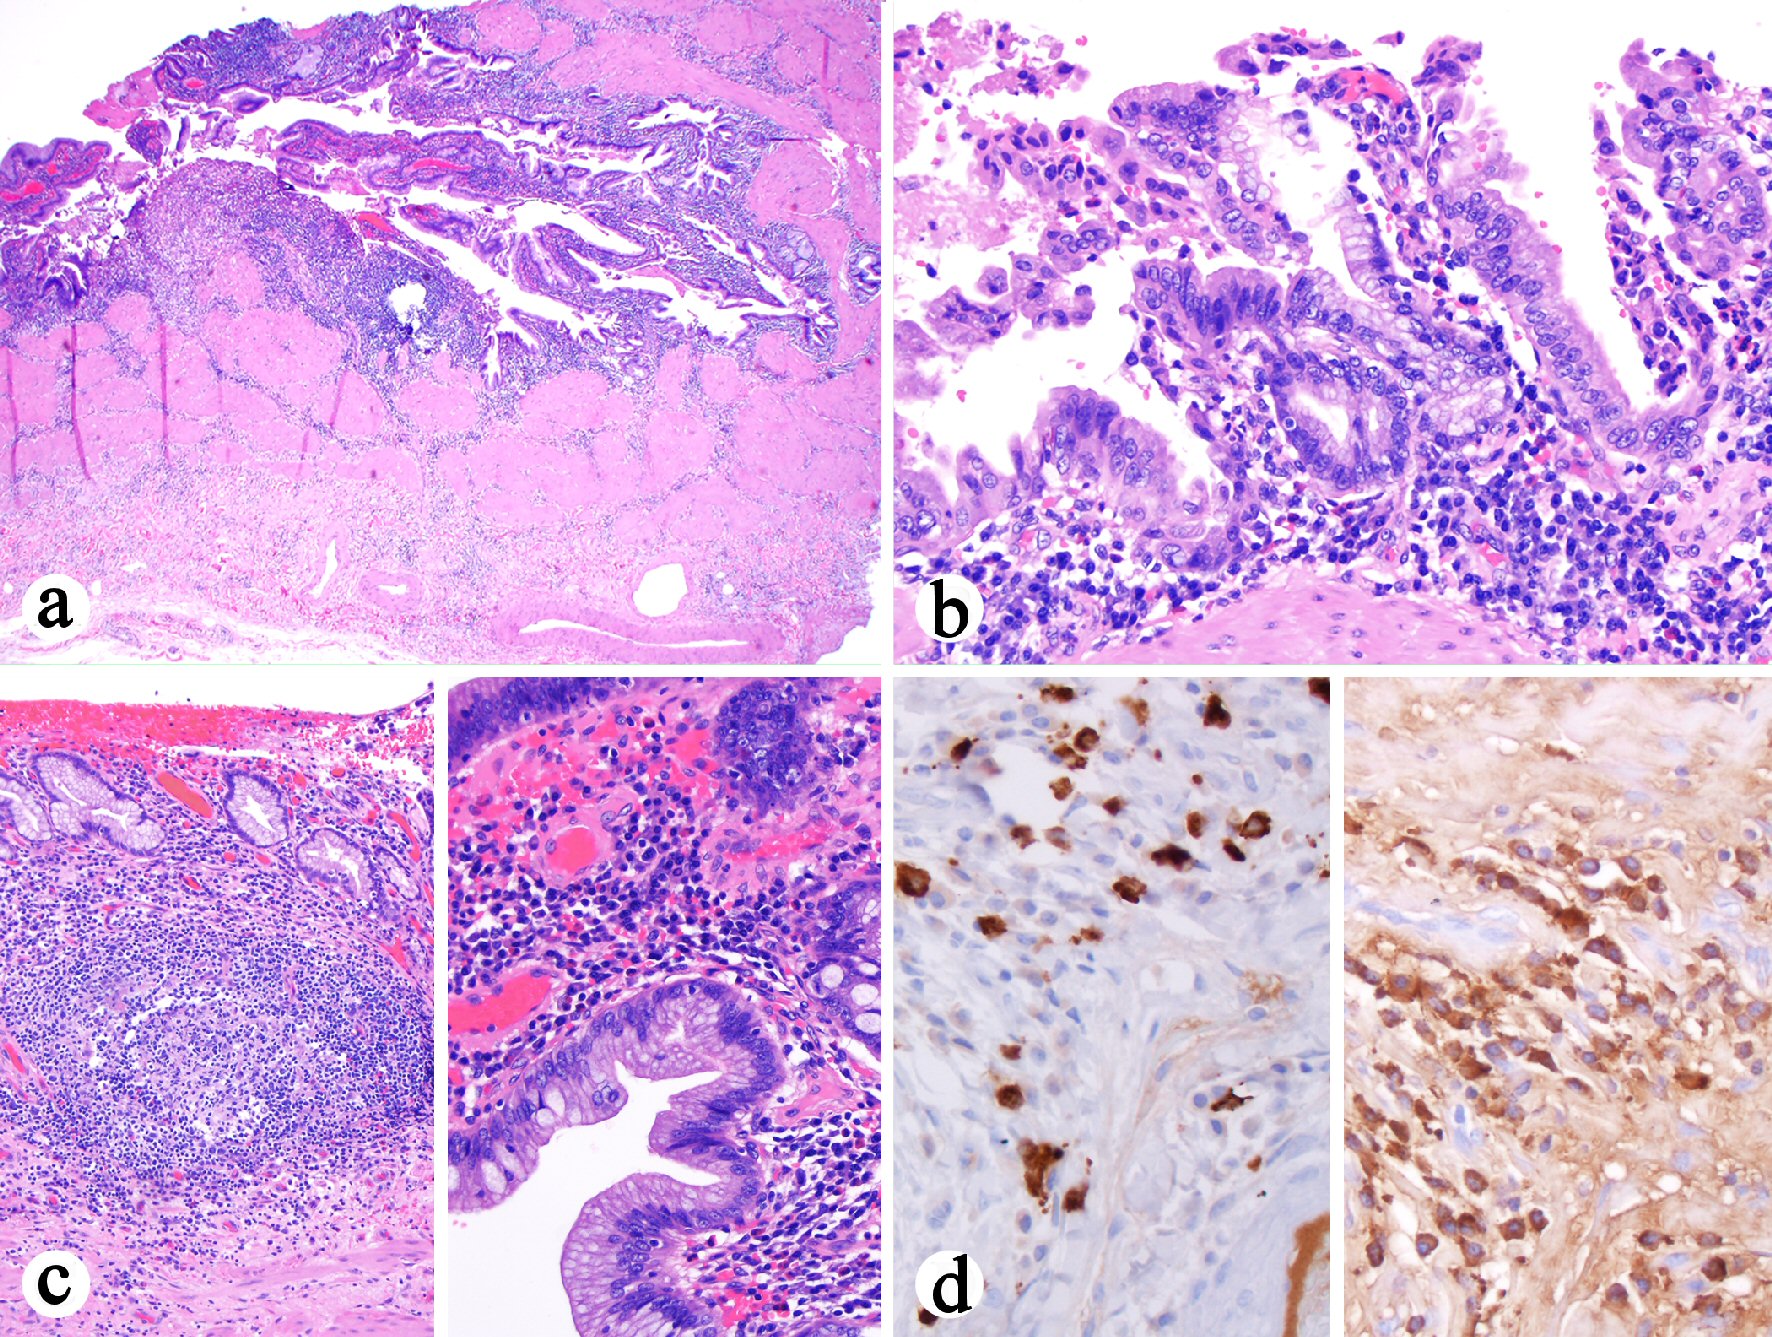
Figure 2. Histologic features of cholecystectomy. (a) Diffuse transmural mononuclear inflammatory infiltrate (H&E stain, 40 ×). (b) The plasma cell-rich mononuclear inflammatory infiltrate (H&E stain, 200 ×). (c) Left: Prominent lymphoid aggregates in the lamina propria (H&E stain, 100 ×). Right: The epithelium shows hyperplasia and focal intestinal metaplasia but negative for dysplasia (H&E stain, 400 ×). (d) Left: Increased number of IgG4 positive cells (immunostain, 400 ×). Right: IgG positive cell infiltrate in the wall (immunostain, 400 ×). The ratio of IgG4 to IgG positive cells in the photographed area was 0.2.
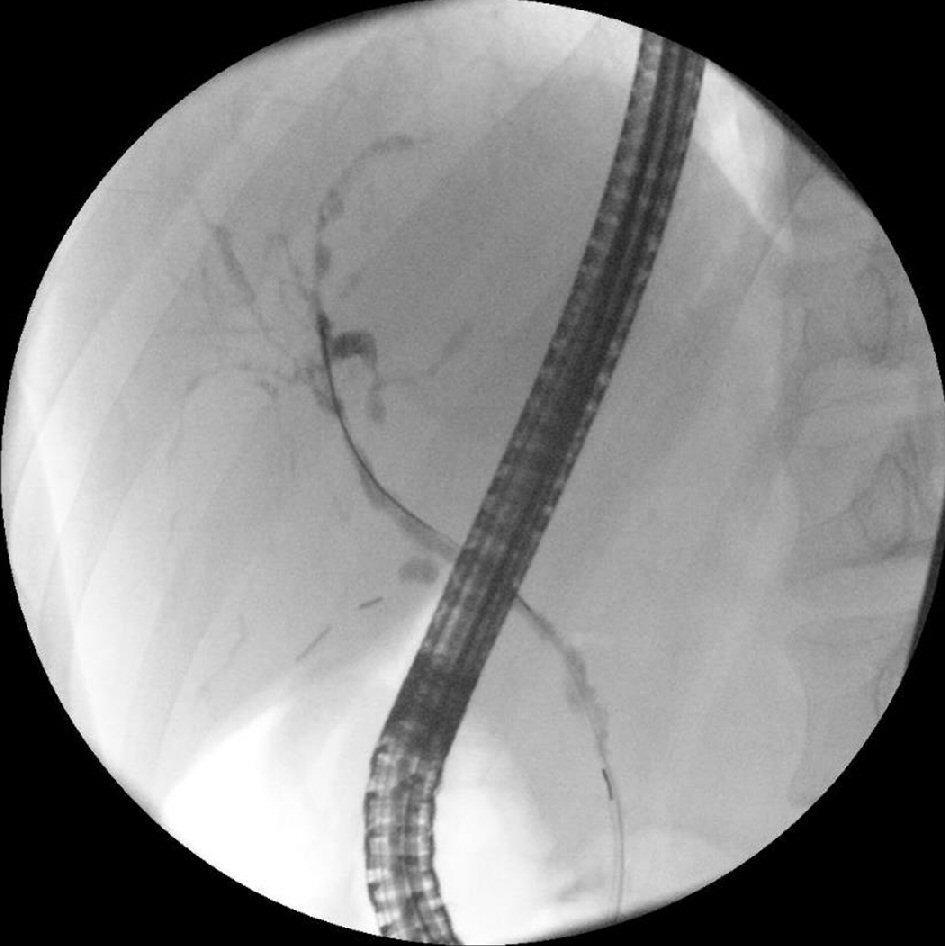
Figure 3. ERCR performed 1 month after cholecystectomy revealing a hilar stricture and a dominant stricture at the left main duct, a chain of lakes appearance and diffuse attenuation of the intrahepatic bile ducts, features of primary sclerosing cholangitis.
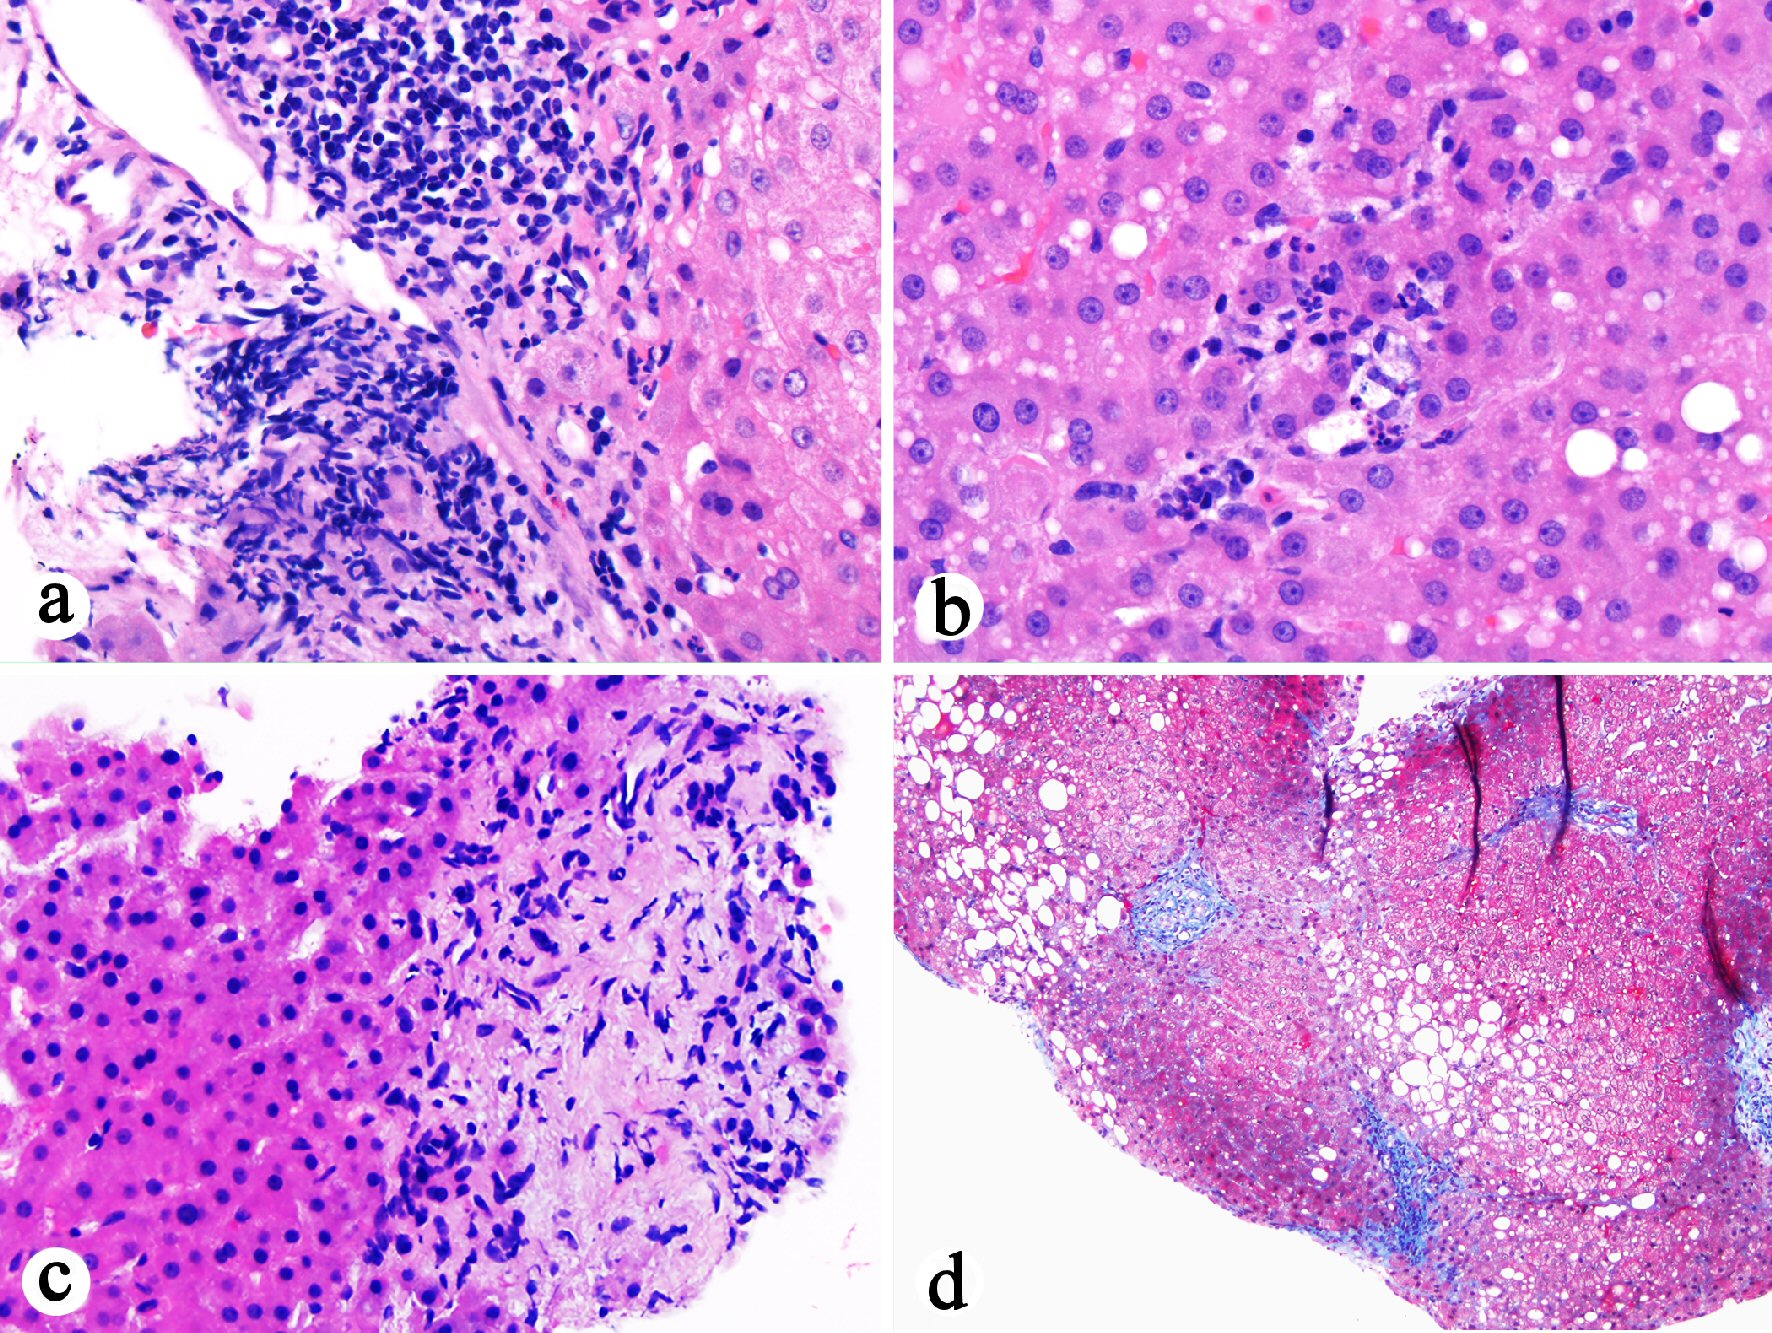
Figure 4. Histopathological examination of previous liver biopsy (October 2016) showing features suggestive of biliary flow impairment. (a) Portal lymphocytic inflammation, bile duct injury, portal fibrosis, and edema (H&E stain, 200 ×). (b) Lobular neutrophilic inflammation with associated hepatocyte apoptosis in addition to mild steatosis (H&E stain, 400 ×). (c) Portal ductular proliferation, portal fibrosis and edema, and periportal hepatocyte rosette formation (H&E stain, 400 ×). (d) Stellate portal fibrosis (trichrome stain, 100 ×).