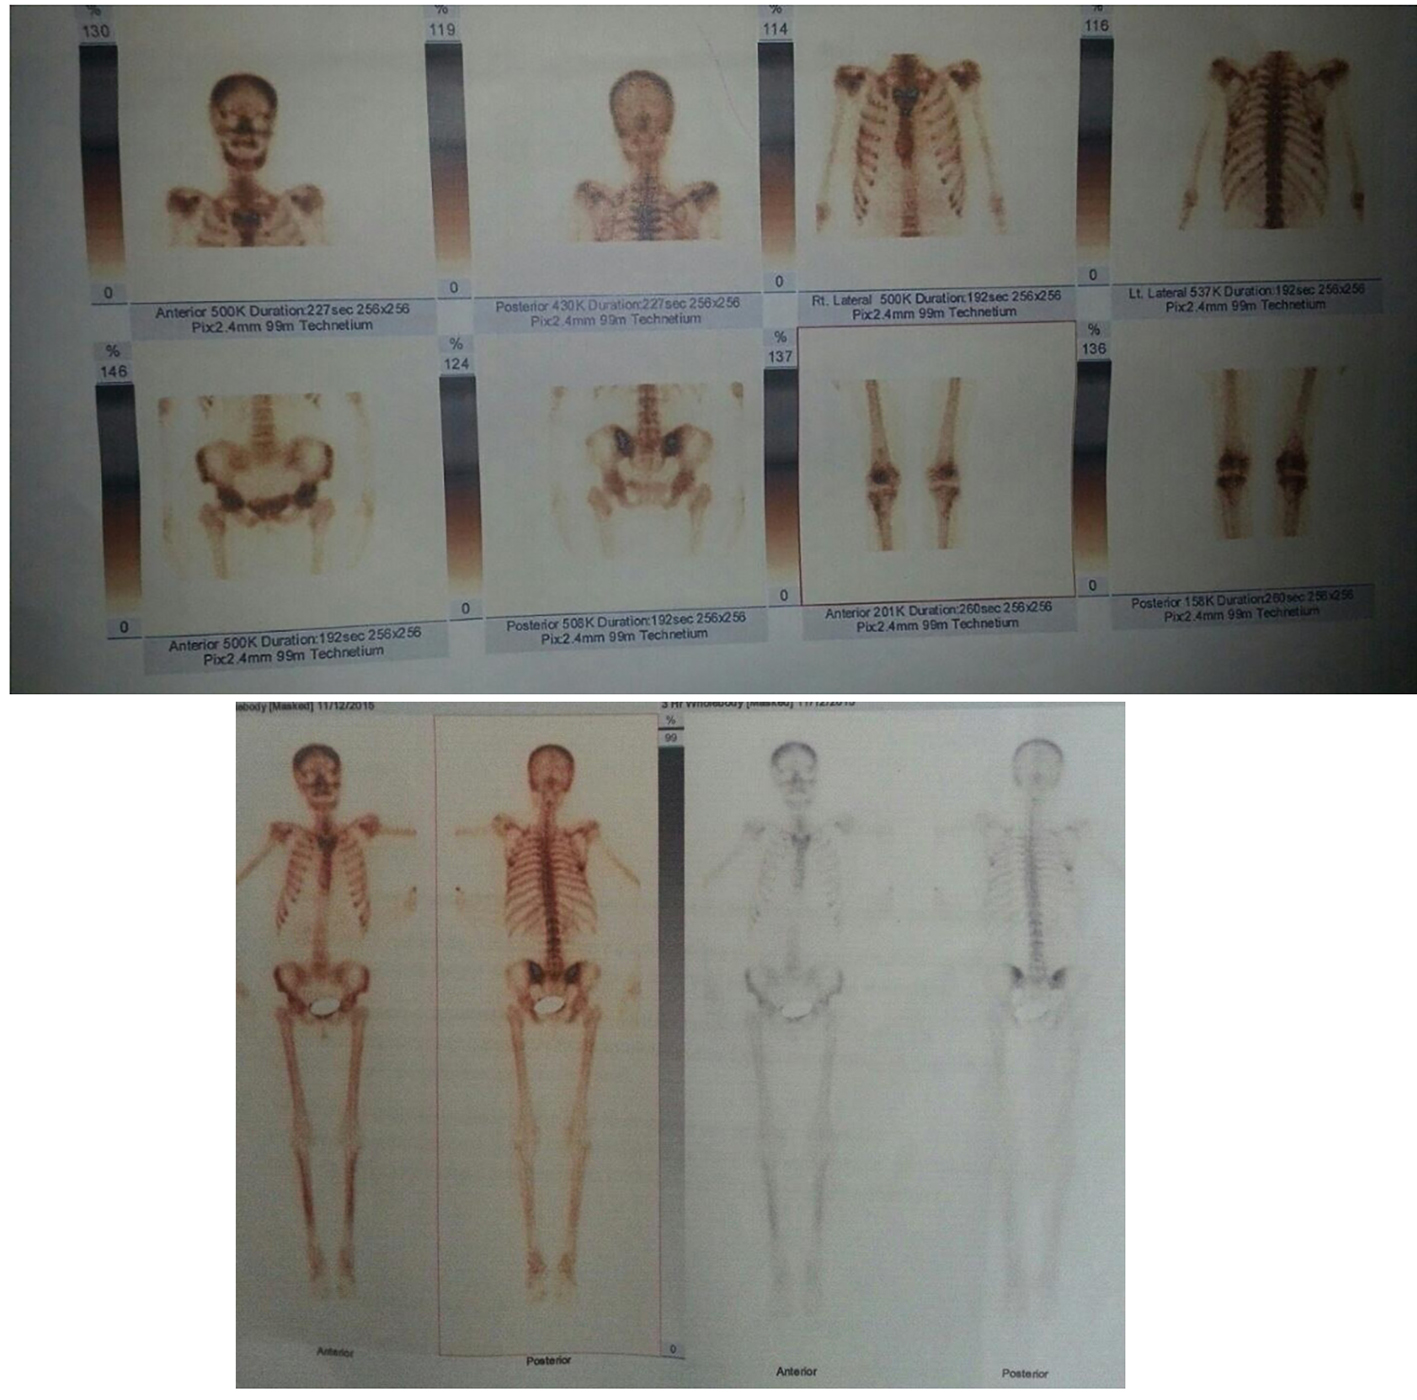
Figure 1. Whole body scintigraphy of bone in admission and after the treatment.
| Journal of Medical Cases, ISSN 1923-4155 print, 1923-4163 online, Open Access |
| Article copyright, the authors; Journal compilation copyright, J Med Cases and Elmer Press Inc |
| Journal website http://www.journalmc.org |
Case Report
Volume 7, Number 10, October 2016, pages 467-470
Severe Osteoporosis in a Young Woman With Celiac Diseases due to Vitamin D Deficiency
Figure
Tables
| On admission | After 4 months | After 7 months | After 10 months | Reference value | |
|---|---|---|---|---|---|
| PTH: parathyroid hormone. | |||||
| 25-OH-vitamin D, ng/mL | 3 | 24.8 | 39.3 | 34.8 | 25.0 - 100 normal 10.0 - 24.9 deficiency < 9.9 insufficiency |
| PTH, pg/mL | 407 | 263 | 86.9 | 36.8 | 12.0 - 72.0 |
| Total calcium, mmol/L | 1.58 | 2.18 | NA | 2.19 | 2.15 - 2.57 |
| Ionized calcium, mmol/L | 1.05 | 1.13 | NA | 1.15 | 1.12 - 1.32 |
| On admission | After 10 months | Reference value | |
|---|---|---|---|
| MCV: mean corpuscular volume; MCH: mean corpuscular hemoglobin; MCHC: mean corpuscular hemoglobin concentration. | |||
| Erythrocytes, /L | 3.3 | 4.6 × 10⁻⁶ | 3.5 - 5.1 × 10¹² |
| Hemoglobin, g/L | 94 | 128 | 110.0 - 150.0 |
| Hematocrit, % | 35.2 | 38 | 35.0 - 47.0 |
| MCV, fL | 73 | 82 | 80.0 - 99.0 |
| MCH, pg | 21.9 | 27.4 | 26.0 - 32.0 |
| MCHC, g/L | 301 | 333 | 310.0 - 360.0 |
| Iron, μmol/L | 4.2 | 14.3 | 9.0 - 30.4 |
| Region | On admission | After 8 months | ||||
|---|---|---|---|---|---|---|
| BMD | T- | Z- | BMD | T- | Z- | |
| BMD: bone mineral density. | ||||||
| Right femur | 0.371 | -4.7 | -4.6 | 0.714 | -1.9 | -1.8 |
| Left femur | 0.375 | -4.6 | -4.5 | 0.693 | -2.0 | -1.9 |
| L-spine | 0.461 | -5.3 | -5.2 | 0.737 | -2.8 | -2.7 |