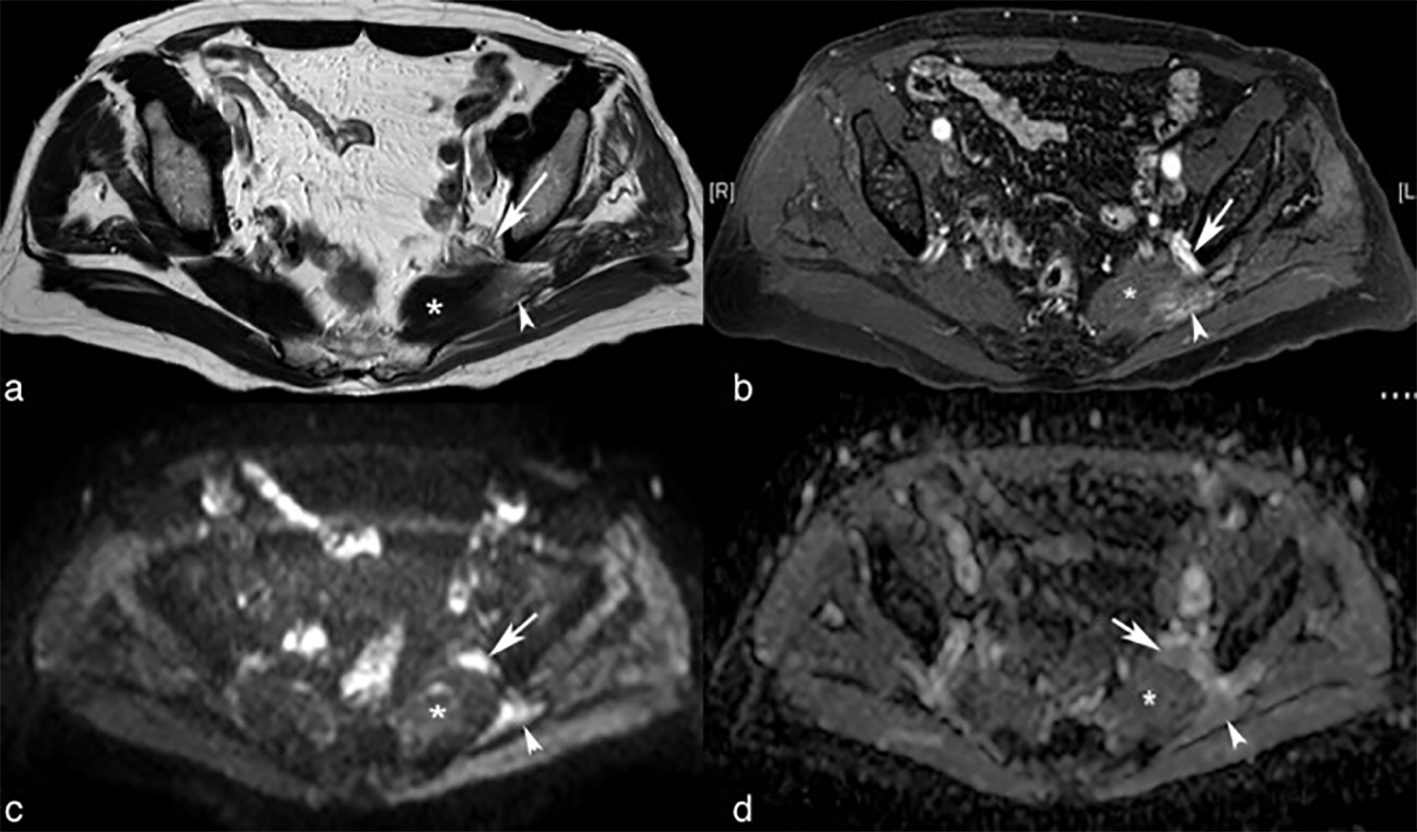
Figure 2. MRI imaging. Axial TSE-T2-weighted (a), gadolinium enhanced fat-suppressed T1-weighted (b), b 1000 diffusion-weighted image (c) and apparent diffusion coefficient map (d) images show a hypertrophied left piriformis muscle (asterisks) compressing the left sciatic nerve (arrow). The left sciatic nerve (arrows) shows increased size and signal intensity on T2-weighted image, enhancement after gadolinium administration and restricted diffusion. Subacute denervation changes on mulateral portion of the hypertrophied left piriformis (arrowheads) and gluteus medius muscles and chronic denervation changes on gluteus minimus muscle also can be seen.
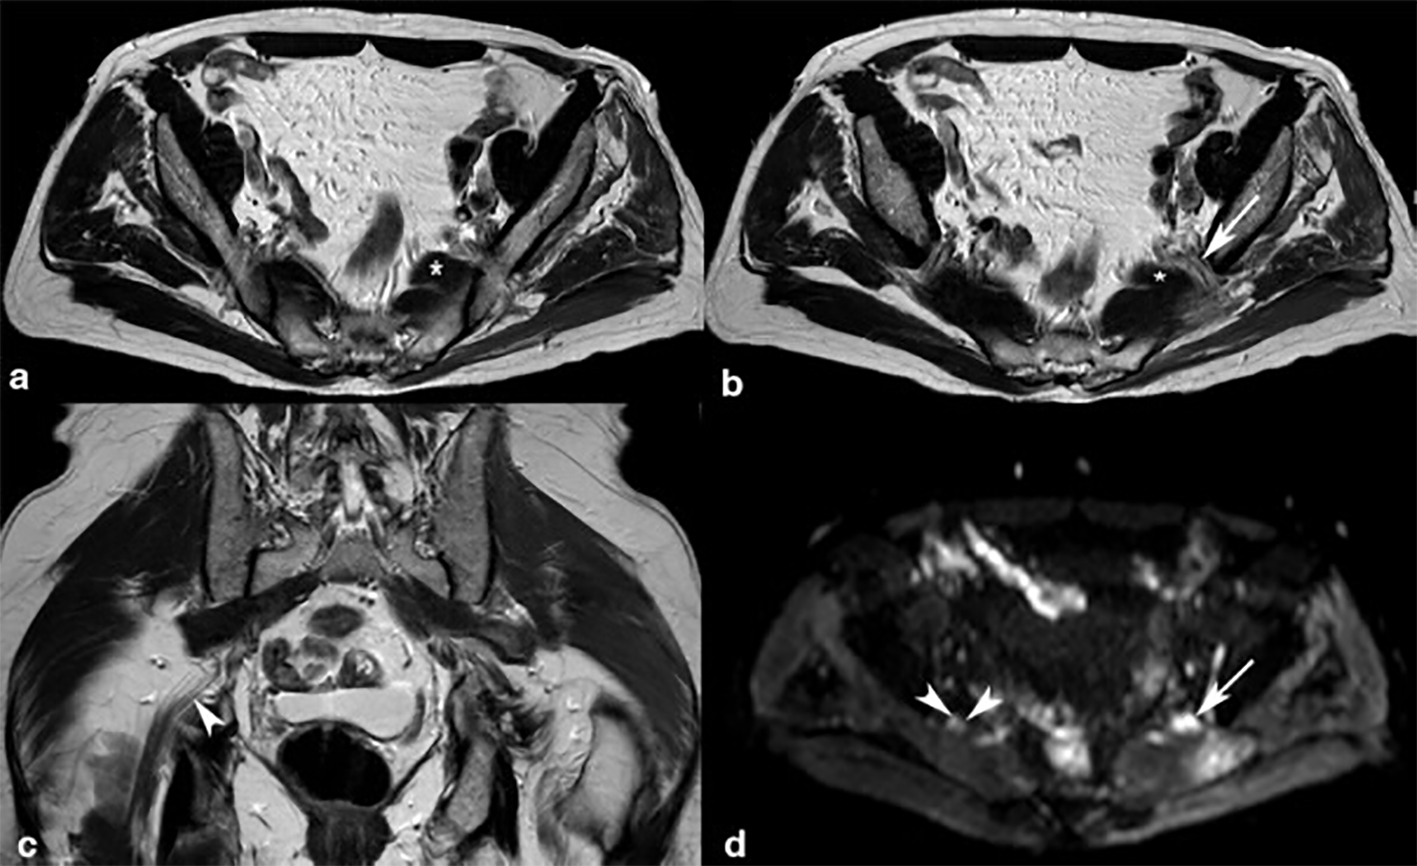
Figure 3. MRI imaging. Axial (a, b) and coronal (c) TSE-T2-weighted images show accessory fibers (asterisks) of left piriformis muscle compressing a thickened left sciatic nerve (arrow). The enlarged left sciatic nerve (arrows) shows increase signal intensity on T2-weighted image and on b 1000 diffusion-weighted image (d). Note the fascicular composition, perifascicular fat and signal intensity of normal right sciatic nerve (arrowheads). Subacute denervation changes on lateral portion of the hypertrophied left piriformis owing to involvement of the sacral plexus also can be seen.