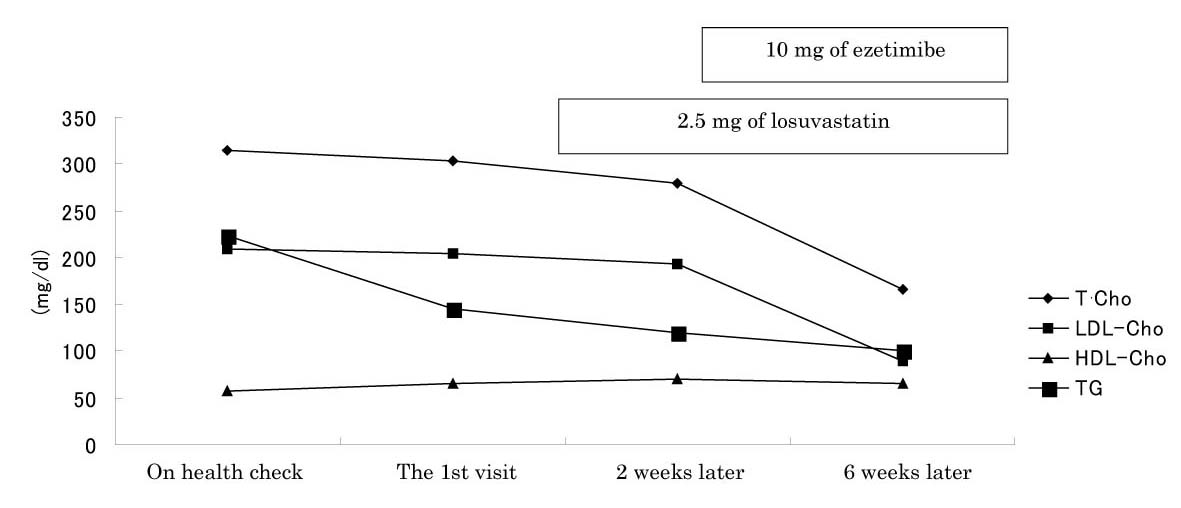
Figure 1. Clinical Course. The reduction rate of LDL-Cho by rosuvastatin was only 5.4 %, and the rate was remarkably increased to 53.4% by adding ezetimibe.
| Journal of Medical Cases, ISSN 1923-4155 print, 1923-4163 online, Open Access |
| Article copyright, the authors; Journal compilation copyright, J Med Cases and Elmer Press Inc |
| Journal website http://www.journalmc.org |
Case Report
Volume 2, Number 2, April 2011, pages 44-47
Successful Treatment of Statin Resistant Hypercholesterolemia by an Inhibitor of Cholesterol Absorption, Ezetimibe
Figure
Table
| CBC | |||||||
|---|---|---|---|---|---|---|---|
| The values, except for TSH and the apolipoprotein profile, were obtained before initiating the drugs. TSH and the apolipoprotein profile were obtained 6 weeks after initiating 2.5 mg of losuvastatin and 10 mg of ezetimibe, when T Cho and LDL-Cho were 232 mg/dl and 136 mg/dl, respectively. | |||||||
| WBC | 4880/µL | ||||||
| Hb | 13.7 g/dL | ||||||
| Plt | 21.5 x 10⁴/µL | ||||||
| BC | |||||||
| The values, except for TSH and the apolipoprotein profile, were obtained before initiating the drugs. TSH and the apolipoprotein profile were obtained 6 weeks after initiating 2.5 mg of losuvastatin and 10 mg of ezetimibe, when T Cho and LDL-Cho were 232 mg/dl and 136 mg/dl, respectively. | |||||||
| TP | 7.3 g/dL | ||||||
| Alb | 4.2 g/dL | ||||||
| BUN | 15 mg/dL | ||||||
| Cr | 0.62 mg/dL | ||||||
| UA | 3.8 mg/dL | ||||||
| Na | 141.7 mEq/L | ||||||
| K | 4.59 mEq/L | ||||||
| Cl | 102.3 mEq/L | ||||||
| Ca | 9.4 mg/dL | ||||||
| AST | 15 IU/L | ||||||
| ALT | 11 IU/L | ||||||
| CK | 63 IU/L | ||||||
| TCho | 303 mg/dL | ||||||
| HDL-Cho | 65 mg/dL | ||||||
| LDL-Cho | 204 mg/dL | ||||||
| TG | 146 mg/dL | ||||||
| TSH | 3.412 µIU/mL | ||||||
| Lipoprotein Fraction | |||||||
| The values, except for TSH and the apolipoprotein profile, were obtained before initiating the drugs. TSH and the apolipoprotein profile were obtained 6 weeks after initiating 2.5 mg of losuvastatin and 10 mg of ezetimibe, when T Cho and LDL-Cho were 232 mg/dl and 136 mg/dl, respectively. | |||||||
| α | 32% | ||||||
| Pre β | 20% | ||||||
| β | 48% | ||||||
| Apolipoprotein Profile | |||||||
| The values, except for TSH and the apolipoprotein profile, were obtained before initiating the drugs. TSH and the apolipoprotein profile were obtained 6 weeks after initiating 2.5 mg of losuvastatin and 10 mg of ezetimibe, when T Cho and LDL-Cho were 232 mg/dl and 136 mg/dl, respectively. | |||||||
| A-I | 167 mg/dL | ||||||
| A-II | 39.5 mg/dL | ||||||
| C-II | 5.0 mg/dL | ||||||
| C-III | 11.1 mg/dL | ||||||
| E | 3.0 mg/dL | ||||||