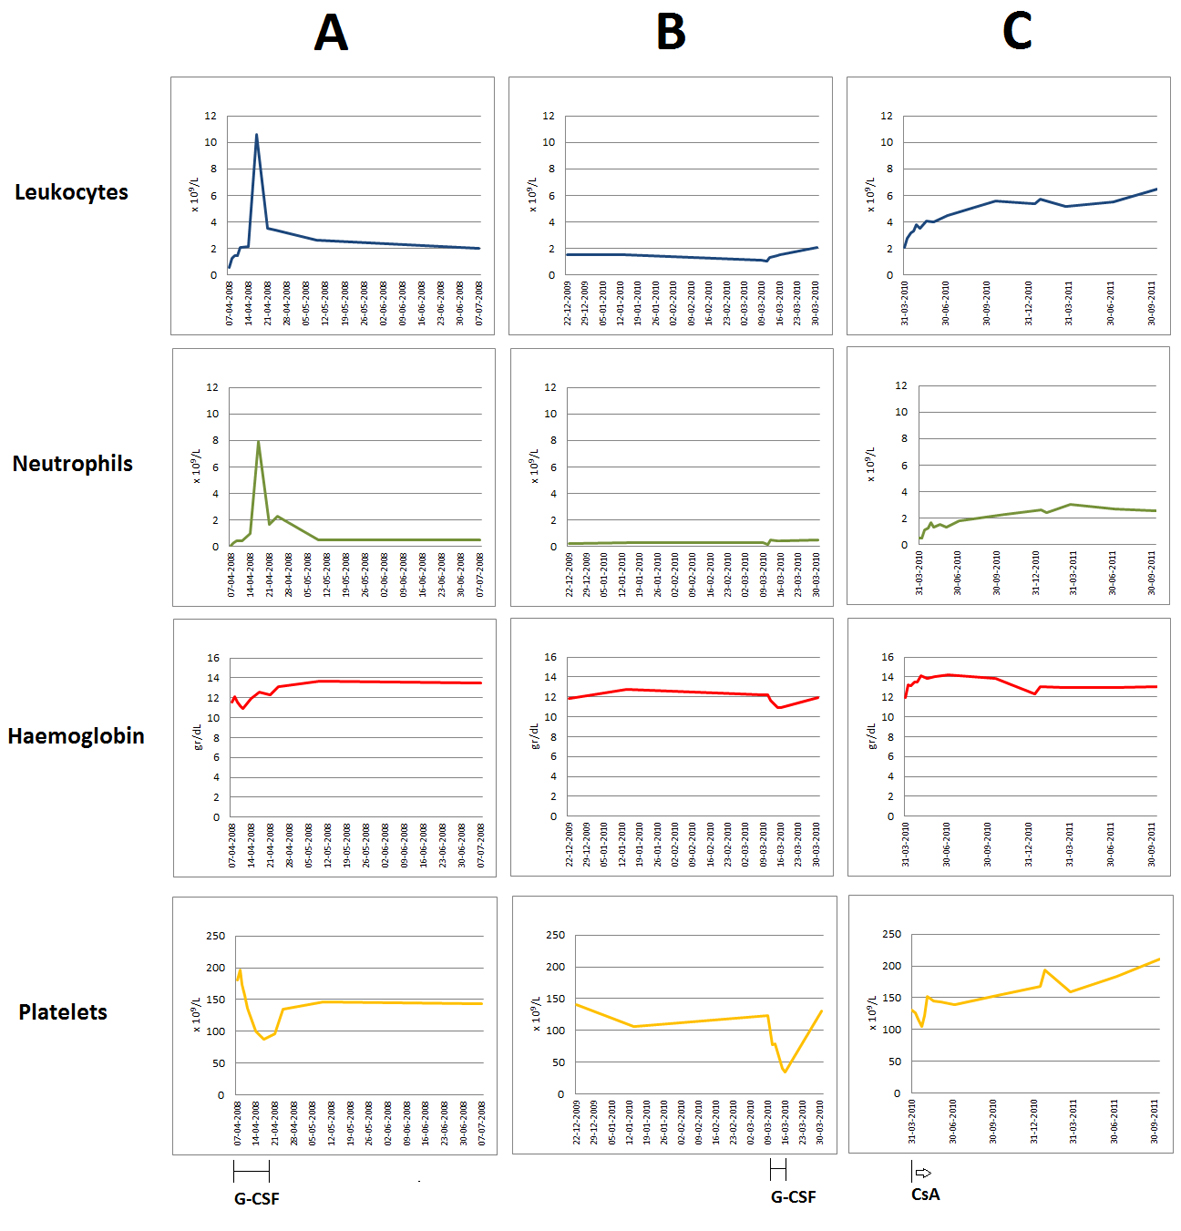
Figure 1. Evolution of the peripheral blood counts (leukocytes, neutrophils, haemoglobin and platelets) over time. Graphics document the chronic severe neutropenia, mild anaemia and mild thrombocytopenia observed in this patient, the two episodes of thrombocytopenia associated with G-CSF administration for undercurrent infections (A, B), as well as the neutrophil recovering after starting on oral CsA, with normalization of all blood counts after long term therapy (C).
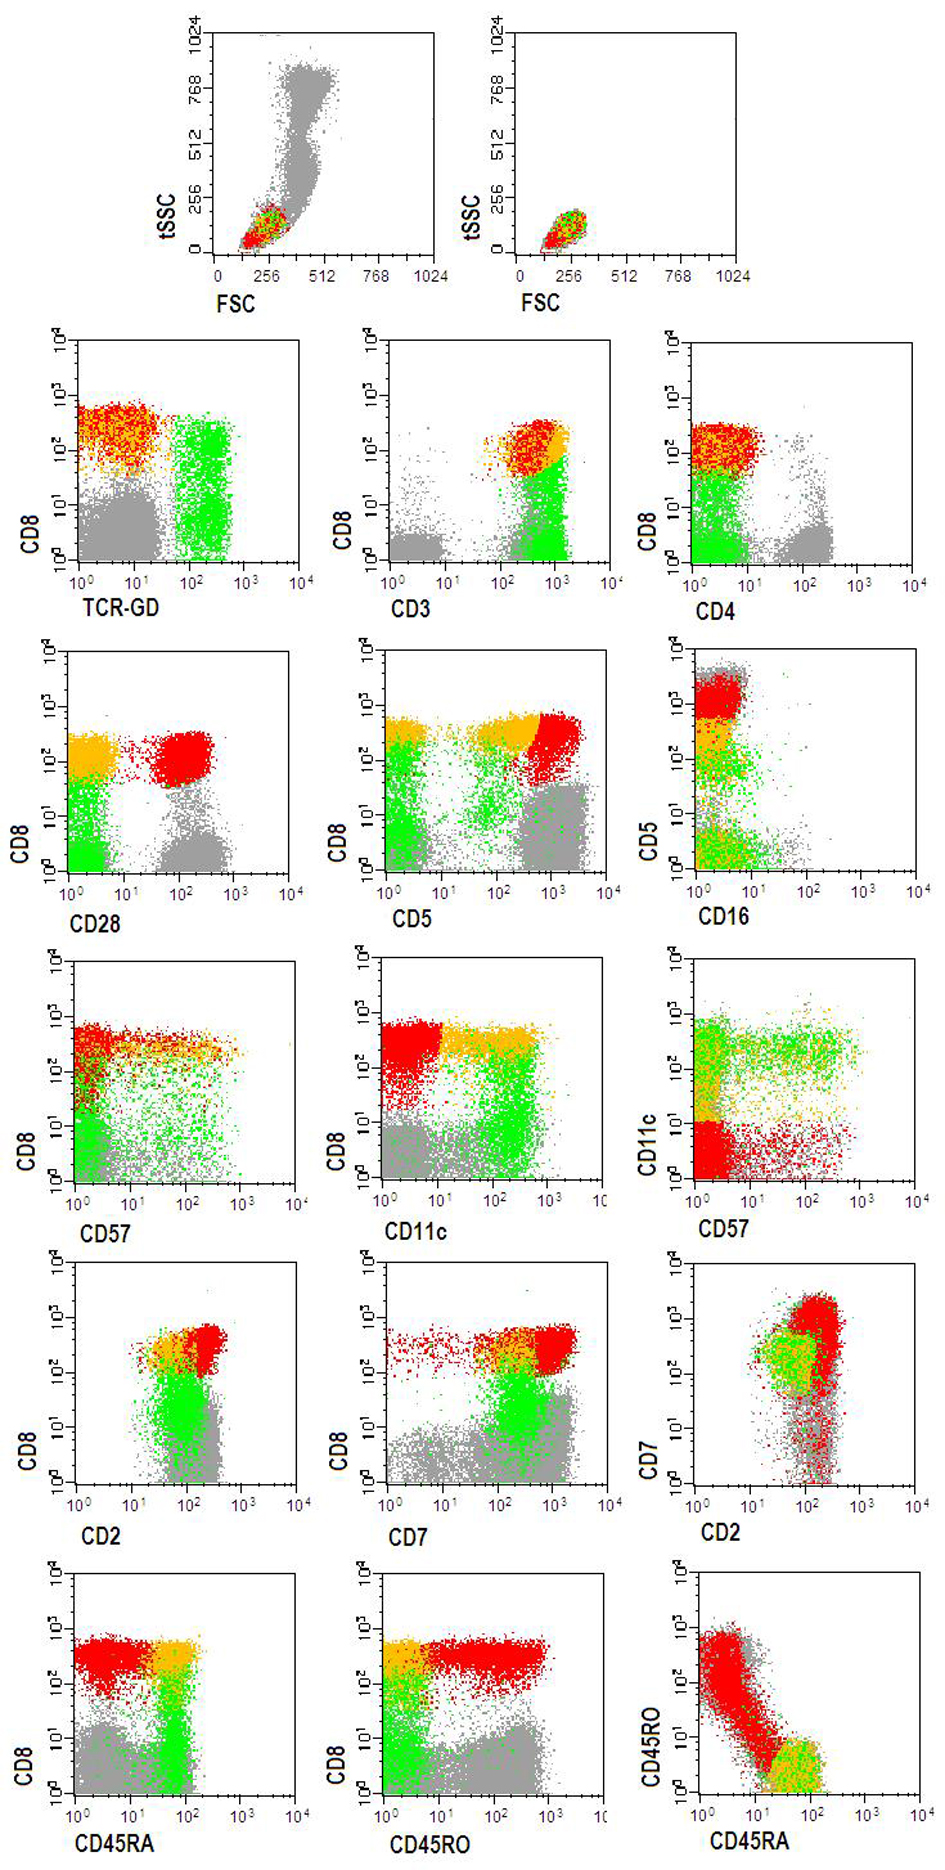
Figure 2. Flow cytometry dot plots showing the abnormal TCRαβ+CD8+strong (yellow dots) and TCRγδ++CD8-/+dim (green dots) T-LGL clones, detected in the peripheral blood. Red dots represent normal CD3+TCRαβ+CD8+strong T-cells. Other peripheral blood lymphocytes are represented by gray dots. Phenotypically abnormal CD3+TCRαβ+CD8+strong (yellow dots) and CD3+TCRγδ+(Vγ+)CD8-/+dim (green dots) T-LGLL cells had a similar immunophenotype for the majority of the markers: CD2+dim, CD3+, CD5-/+dim, CD7+dim, CD11c+,, CD16-, CD28-, CD45RA+, CD45RO-, CD57-/+dim. Other markers (data not shown): CD11a+bright, CD56-, CD94-, HLA-DR-/+dim.
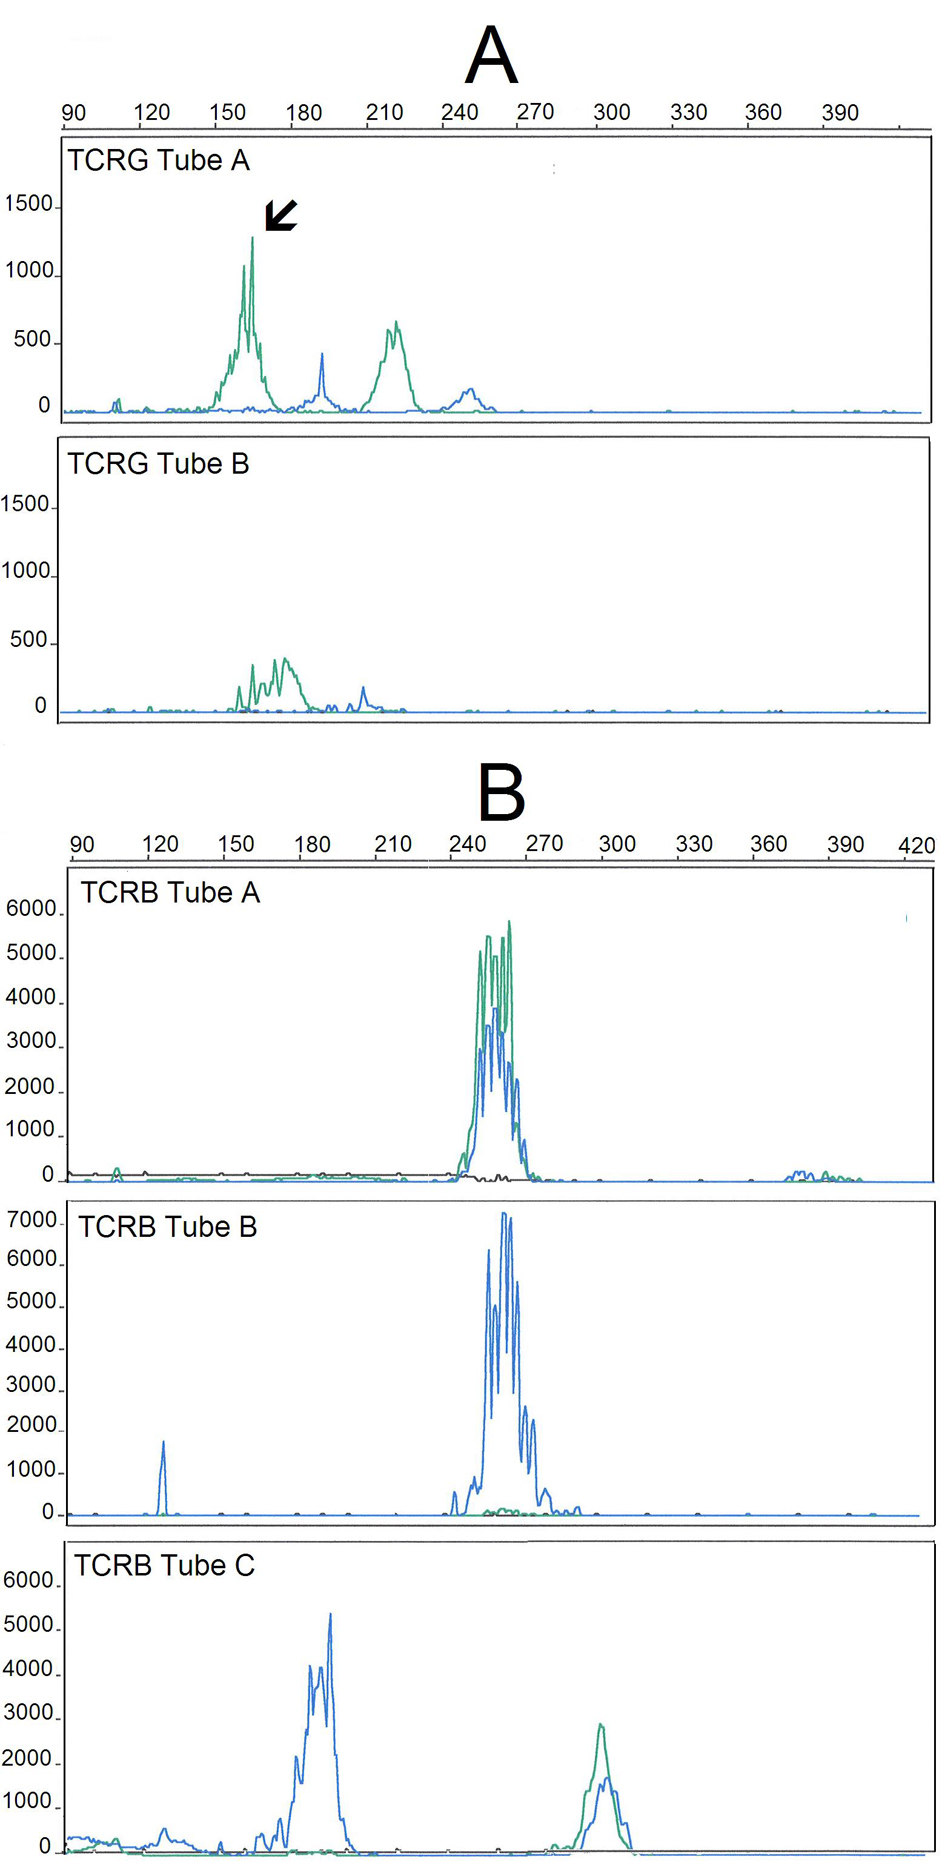
Figure 3. GeneScan fragment analysis of PCR products from TCR gene rearrangements of the DNA extracted from the peripheral blood of the patient, using the five BIOMED-2/EuroClonality multiplex tubes for TCRG (A) and TCRB (B) genes. TCRG and TCRB multiplex tubes are designed with different Vγ/Jγ and Vb/Jb primers, respectively, allowing for the amplification PCR products with different sizes: Vγ/Jγ (240 - 285 nt) and Vb/Jb (285 - 325 nt). Shown are the results obtained in TCRG-tubes A and B (A) and TCRB-tubes A, B and C (B). The analysis of the TCRG gene rearrangements reveals a clonal peak in a polyclonal background (TCRG-tube A, with the arrow indicating the clonal peak) whereas analysis of the TCRB gene rearrangements show a polyclonal pattern, with a typical Gaussian.